How to use the measures simplified?
 As we understand the ThinLine Pressure Test document can sound very complicated, we want to explain the simple basic understanding of what you are seeing.
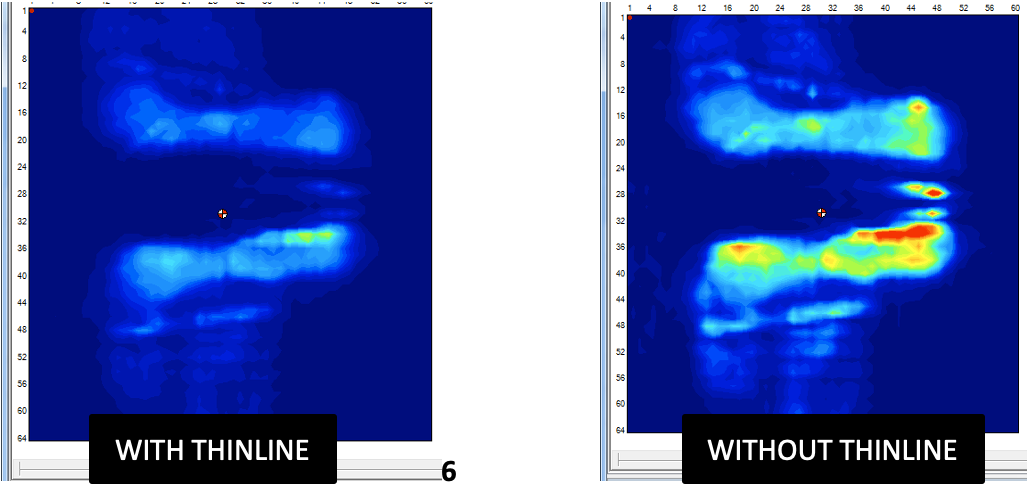
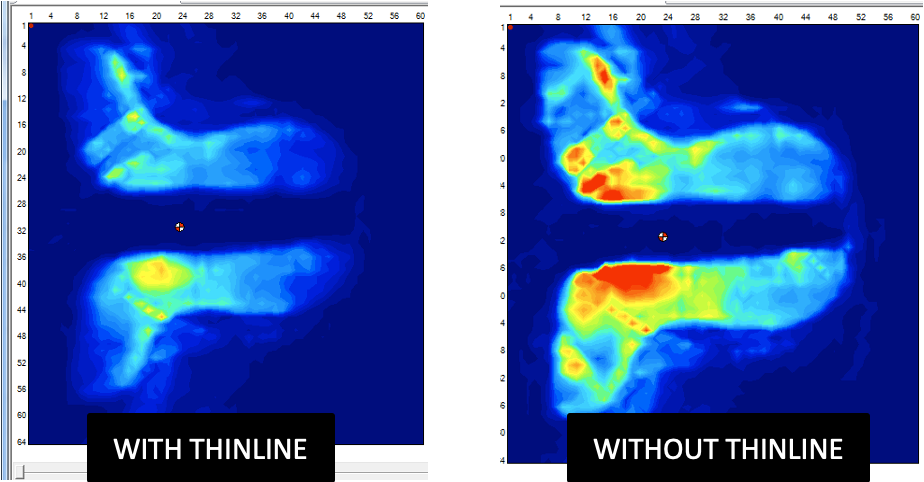
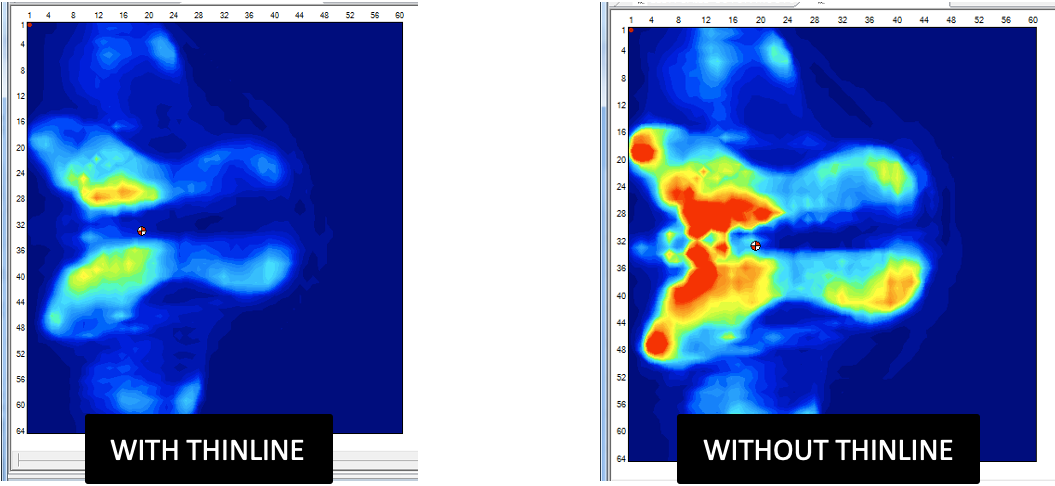
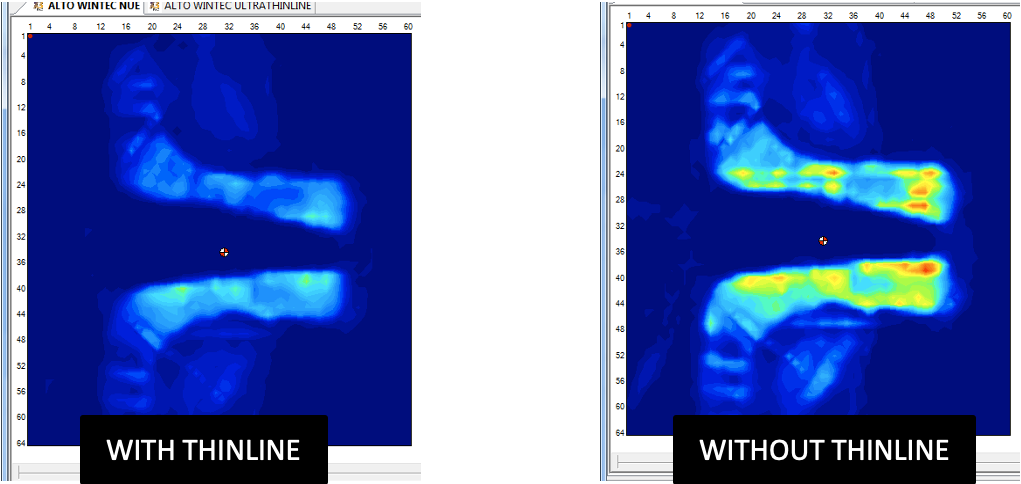
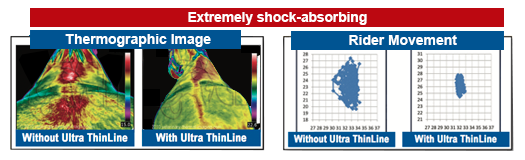
The left pressure-image each time is with the ThinLine in between, the right pressure-image is without. All tests are done with the ThinLine variants. Red and Yellow marks mean significant pressure.
Remark: At some points you read “without saddle pad“, this means without a saddle pad in between to have exact numbers, but not without ThinLine.
The ThinLine Pressure Test you can find below in detailed pdf.
The perfect tests have been done.
How to use the measures more in detail?
The ThinLine Pressure Test measures are meant to add objective information to be combined with the rider’s feeling, the saddler expertise and other members of the team taking care of the horse (vet, coach, …) when it is time to validate or compare the fit of different pad/saddle scenarios.
The priority is an homogeneous pressure distribution.
One then look at absolute values :
-
- Blue-green : moderated pressure
- Yellow-red : significant pressure
And then to the zone :
-
- Horses are more sensitive at the back of the saddle
- The spine must be free of pressure
Scientific research has validated this tool as a reliable method to evaluate the combination of pads and saddles. (A bibliography extract is attached)
Source: Equine surgery, 3rd edition Jorg A. Auer, Dr Med Vet, Section XI Selected Topics of the Lameness Chapter 78 Saddle Evaluations by B. Von Rechenberg
What do our ThinLine Pressure Test report include?
A representative repetitive peak of pressure at the sitting trot on a straight line during 10 seconds.
-
- MAP virtual picture: calculated mean value over the period of each sensors
- MPP virtual picture: max pressure of each sensor during the period
- MAP number: mean value of average pressure
- MPP number: mean value of peak pressure
- RE : rebound ‘(mean variation of peak pressure)
- COP path of the centre of pressure, as a way of evaluating rider’s fixity
- 2 graphs: comparison of average pressure curb and peak pressure curb
- Between plain pad (or without pad) and the studied pad
Result Report of our ThinLine Pressure Tests
In our ThinLine Pressure Tests we are showing some basic results below with and without ThinLine pads. The yellow / red marks represent an increased pressure zone without using ThinLine. Below you can download the detailed ThinLine Pressure Test Result Sheet.